Energy Diagrams and Reaction Coordinates
Energy Diagrams and Reaction Coordinate Basics
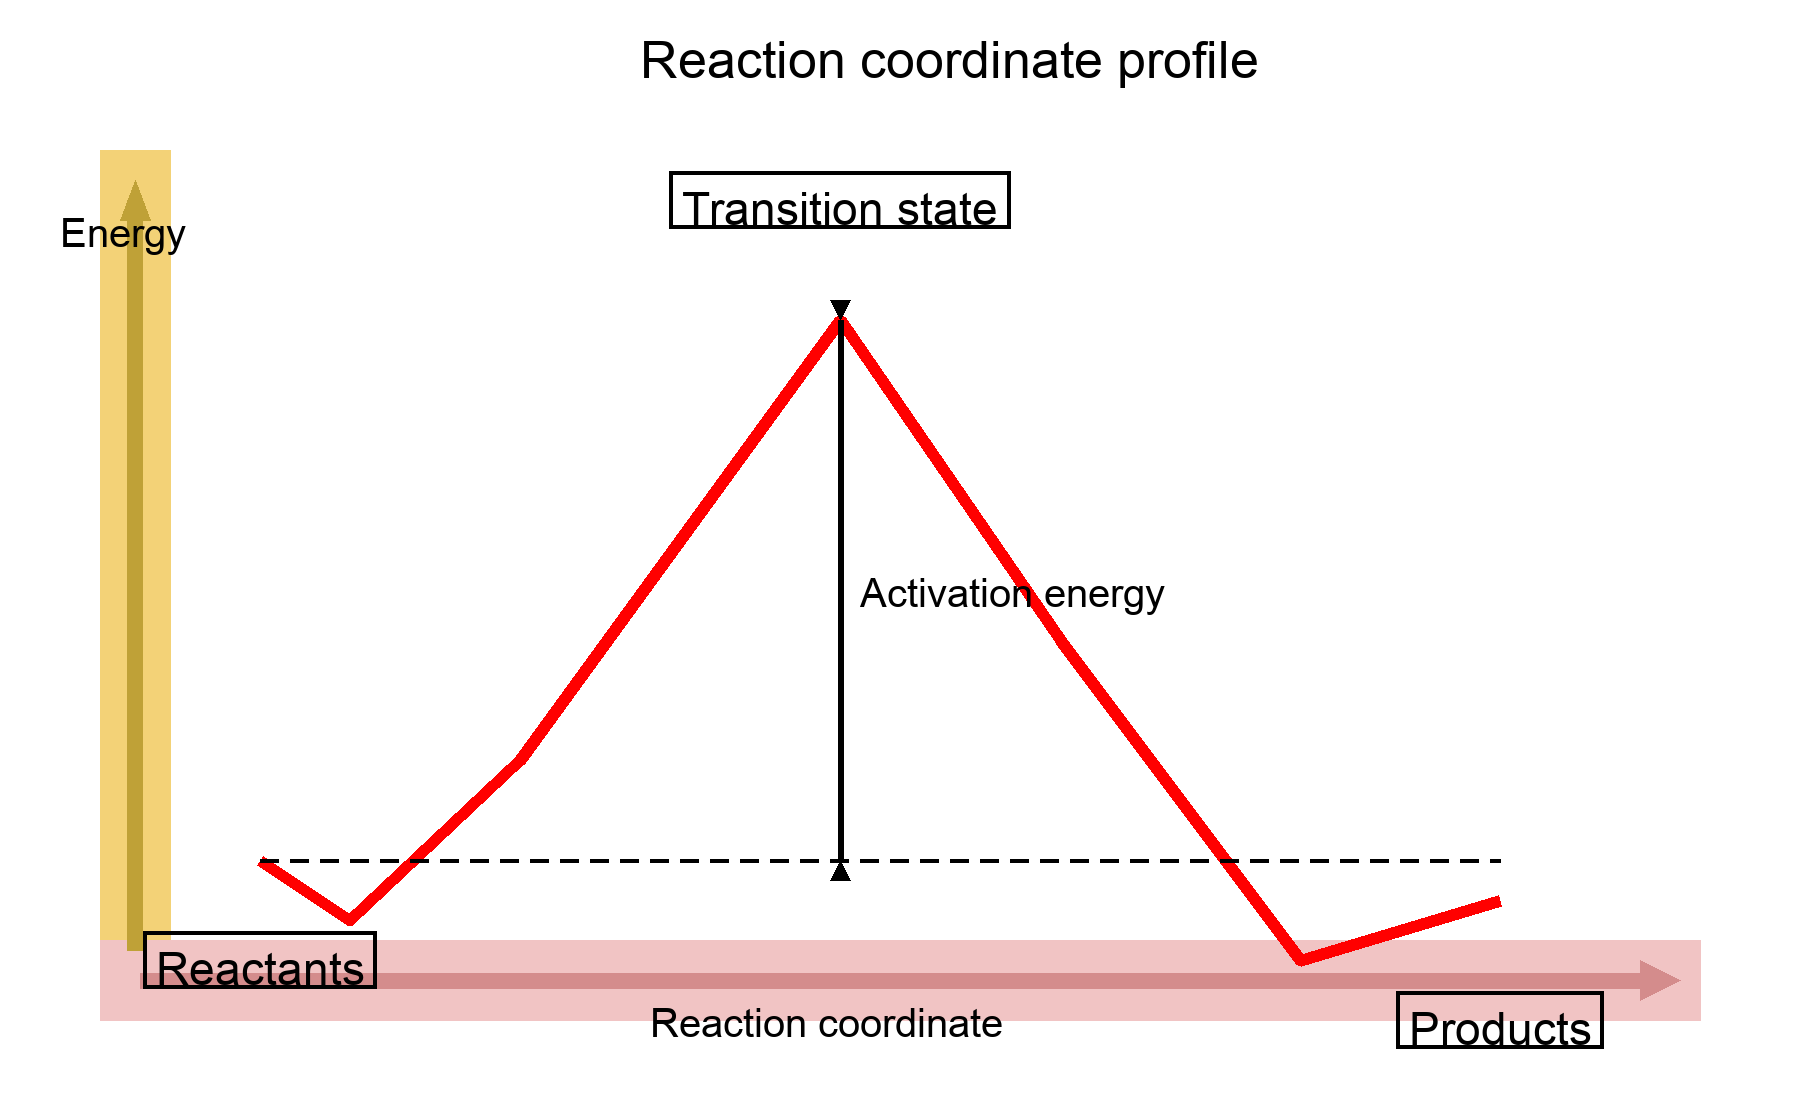
Reaction coordinate diagrams plot energy (y-axis) vs progress from reactants to products (x-axis). They reveal kinetics (activation barriers, rate-determining step) and thermodynamics (overall energy change, exothermic vs endothermic).
Transition States and Activation Energy
- The peak of the curve is the transition state (‡)—highest energy point where bonds are partly broken/formed.
- Activation energy (Eₐ) is the energy gap from reactants to the transition state; larger Eₐ = slower step.
- Multi-step reactions have multiple peaks (TS) and valleys (intermediates); the tallest barrier is rate-determining.
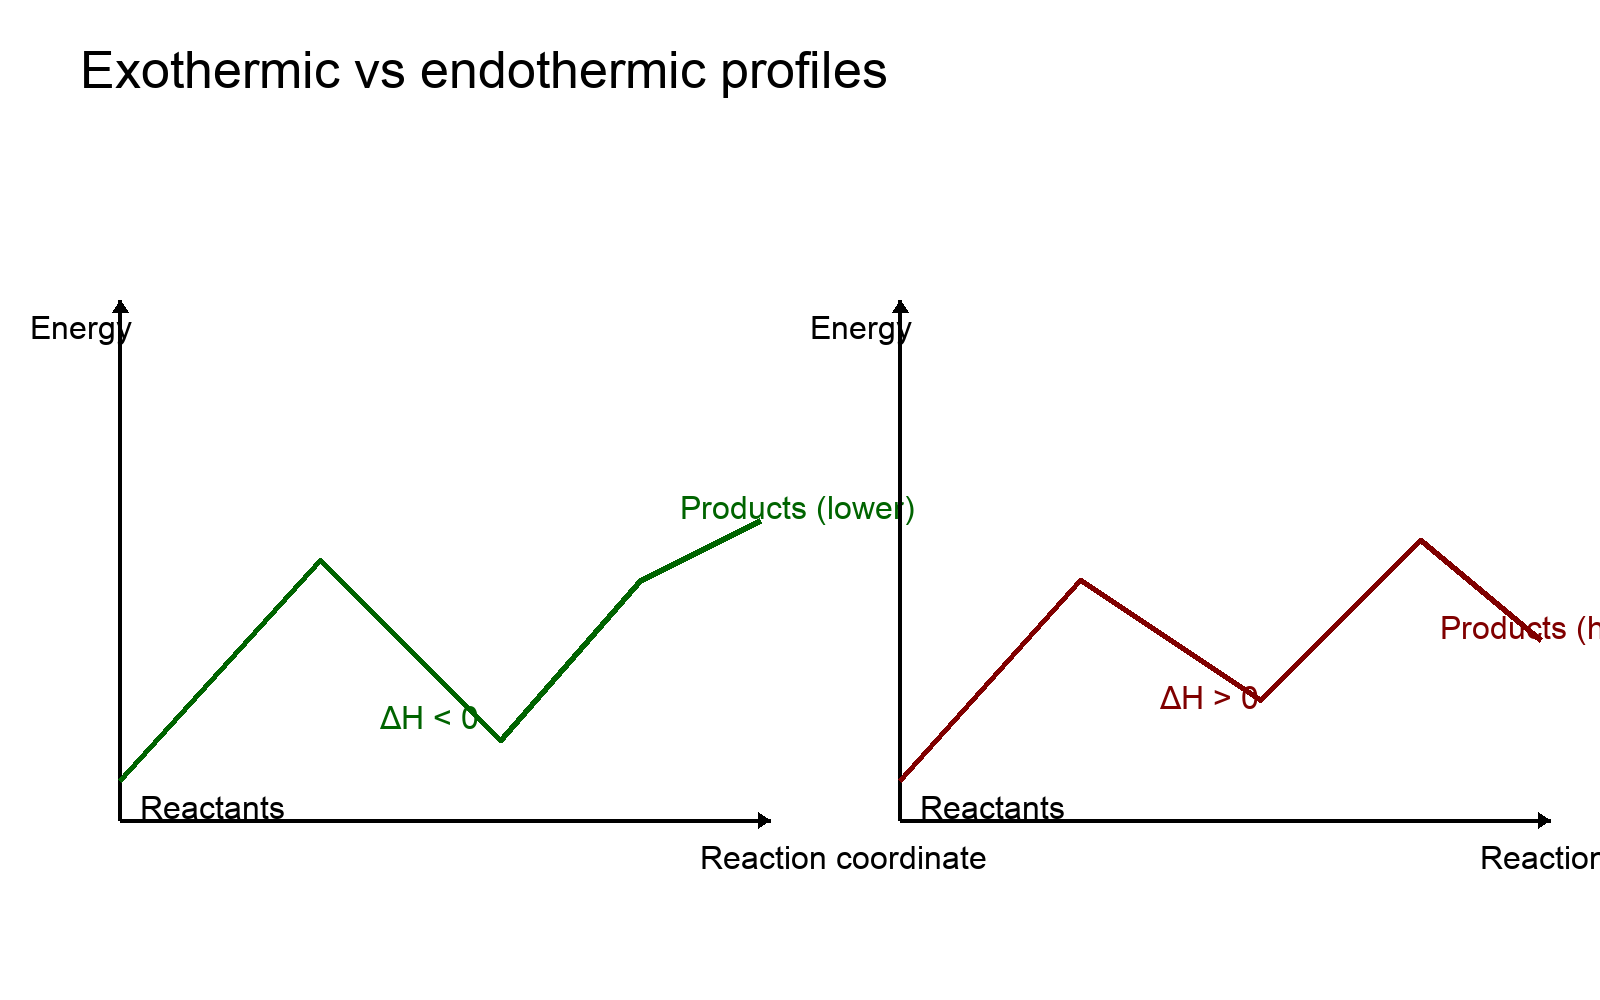
Exothermic vs. Endothermic Profiles
- Exothermic: products lower in energy than reactants; ΔH < 0 (energy released).
- Endothermic: products higher than reactants; ΔH > 0 (energy absorbed).
Summary
- Peaks = transition states; height to peak = activation energy (controls rate).
- Valleys (if present) = intermediates in multi-step mechanisms.
- Product energy vs reactant energy distinguishes exothermic vs endothermic outcomes.